BTC: A Disbelief Rally and a Shifting of Battlefields
BTC continues to grind higher begging the question. Is it an upwards accumulation or a bull trap? Plus other lessons learned
When we last covered BTC, we outlined that regardless of whether you believed BTC was going to $45k or $30k, you needed to be getting involved. If you began DCAing and buying small increments, you’d be up. But you didn’t, did you? You want the Alts and the 1000x. Well, congratulations. BTC is now grinding up and sitting in no man’s land alongside ETH(which has done nothing all year). Let’s get right into it.
PS: what happens with Kraken and Binance will not be part of the analysis since, unless you are an insider, you cannot quantify. It is a waste of time to ponder on things out of your control, so we’ll focus on what we do know.
COUNTDOWN: T-Minus 50 DAYS until the BlackRock BTC ETF approval deadline. We are now on a clock
Welcome to ChopVember
It must be stated that the overall picture is not as clear as it was even a few weeks ago, as is the nature of crypto. At this point in time, BTC continues to grind upwards, and anyone who says they have a clear idea of what will happen is selling porky pies. Here’s why:
Technical Analysis (NOT Again!)
BTC has failed to close above the next key liquidity level of $38,000 USD. The goal isn’t to just breach this threshold but to be able to sustain itself above it with enough steam to swat away would-be shorters that come hunting.
$38,000 is a key point of Support or Resistance. It will act like a magnet and need to become a place of support for BTC (and emotional support for us) before it can run again.
Volume tells all. Looking at the bottom shows that Volume has fallen significantly below its moving average. This is either due to a deadlock between Long/Shorts or the fact that the market is simply waiting
The moving averages also tell a story about Macro trends. Here’s how to read them:
Green = 50 Day SMA
Yellow = 100 Day SMA
Red = 200 Day SMA
These are not fluid and lag. However, by this token, they are also good indicators of OVERALL (Note Overall) trends. On the Daily chart, the 50 Day > 100 Day > 200 Day. They are flowing in harmony. This does not paint the whole picture but tells us that the Directional bias is still long in the LONG term.
The question is. Can I trade this market? The answer is F$#K no. A ranging or choppy market is only of use to the most expert of scalpers. As we mentioned before, we are in BTC for the long run; therefore, this is something we will not be touching for short-term plays. Here is why.
Data Analysis (the good stuff…not so much at the moment)
As before, we are looking at the following to give us more insight.
By looking at the:
Open Interest: Number of open contracts on the market
Funding Rate: An exchange mechanism to ensure the Spot price is in line with the Futures price(penalizing Longs/shorts if the price strays either way too heavily)
CVD Spot volume: The number of spot buying/selling on the asset.
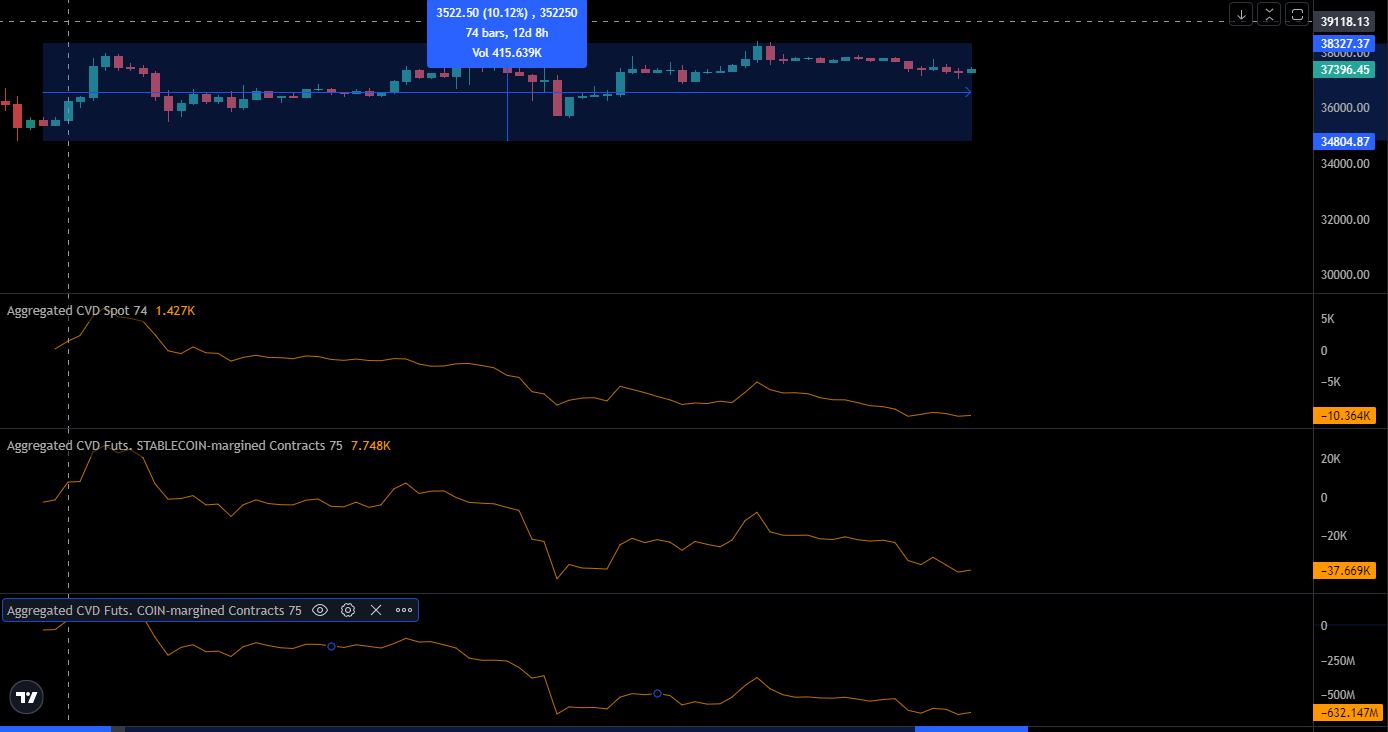
The first chart shows us the CVD data for SPOT and Futures. There is some profit-taking but absolutely nothing else of note.
Even the Open interest and Funding rates are getting tighter and more consolidated. There is simply too much tight spot-holding and not enough new liquidity being introduced into the market at the moment.
There may be a scenario where, in the short term…hold it no one cares about BTC. WHY? Because BTC is slowly becoming the boomer asset of the crypto market. The nature of money is to attach itself to the best-performing asset. BTC was all well and good until the Siren Song effect came into play.
What is the Siren Song?
BTC go boom. investors go to BTC
BTC begins to range, and investors(short-term) get bored
Alts begin to pump. Investors flow to Alts (Eg SOL and AI alts pump)
Alts begin to dump 40%, Investors Panik
Money flows to Onchain. Investors flow to Onchain
Onchain dumps 70%, Investors jump off a cliff
HarryPotterObamaSonicInu10 pumps, Investors climb back up the cliff
HarryPotterObamaSonicInu10 delists, Investors jump off a cliff again
Repeat Cycle.
TLDR: There is no short-term directional bias that can be seen here.
Why shouldn't I trade this market?
You will note that nothing here is giving a directional bias in the short term. This is intentional as we ourselves are not trading this market. Sometimes, no trade is the best trade. The risk/reward is off as BTC has only appreciated 14% in the last 30 days. The big swing is over now, trading it now is nothing more than FOMO. Your best trades will come in a trending market, and this November, excuse me, Chopvember has been anything but. Do not FOMO into a short-term 5x Leveraged buy BTC trade if you can make it simpler by just DCA’ing instead. We are not trying to fade and outsmart the market, and neither should you.
So, is the Bitcoin ETF priced in? Short-term Yes, Long-term HELL NO. Here’s the juicy Analysis
Logarithmic Regression Analysis
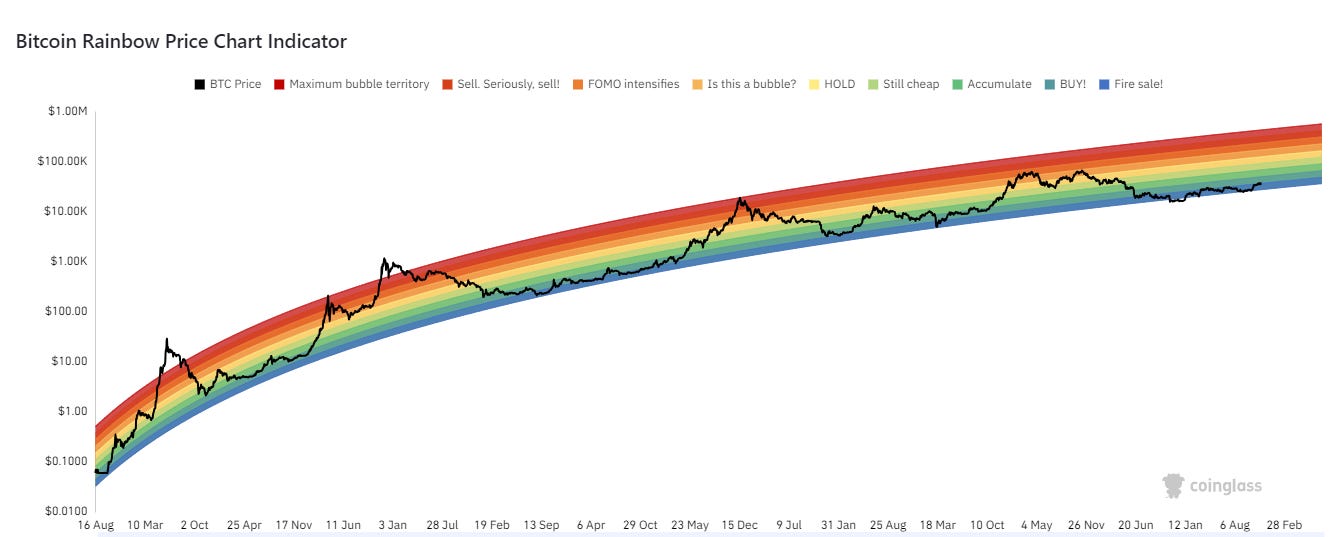
This is our Secret weapon and our in-house LGBTQ+ friendly indicator. This is probably the most interesting thing I have seen in a while. It is a chart that uses a logarithmic growth curve to forecast the potential future price direction of Bitcoin. It overlays rainbow color bands on top of the logarithmic growth curve channel to highlight market sentiment at each rainbow color stage as the price moves through it. Therefore, it highlights potential opportunities to buy or sell.
This will not tell you whether to buy or sell at 33k or 38k. This indicator thinks in years, not weeks. You need to zoom out and remember that we have been in the bear market for over a year and are only now coming out of it. This indicator tells us that BTC, in terms of relative heat, is still very much in a cool zone. This means that given everything else we have covered, BTC is still bullish.
The most important takeaway you will read today
The one thing you must note is that like oil, the introduction of smart money will make 2024 a much more competitive landscape, resulting in increased stress on BTC's price. Notice that with every cycle in BTC, whether it be 2011, 2013, 2017 & 2021, the extremes of BTC have been more and more constricted. The price of BTC did not once go beyond the red extremes in 2017 or 2021. You must come to terms with the fact that BTC is no longer the asset it once was. It will not make you a multi-millionaire if you have $10,000 to invest. It has become the large cap of the Crypto space. This is not to say it will not make you money, but unless you are swinging volume, BTC does not equal lambo anymore.
You must shift your thinking towards unexplored space. This will be more treacherous as you move to Alts and onchain, but if you embrace the struggle, you will become all the wealthier for it.
Conclusion
The BTC corridor is still the path to wealth, but what do you consider wealth? All I have shown today shows a short-term dip to come with BTC, with a significant uptrend leading into the ETF, which is seven weeks away. What happens after that, maybe a sell the news event.
However, the other purpose of this piece was to show that the extremities in performance in BTC are not the 100x that we used to get. It is now a commodity, adopted by businesses and governments alike. And with that comes the need for price stability both on the upside and downside. Crypto is one of the last spaces in which you can make life-changing money, but the board has shifted.
Just like me, you will need to dig deeper and move away from where institutions play and into fresh battlefields like alts and Onchain markets in order to actually get that lambo this time.
Vroom Vroom :)
Let’s make some money :)
Thank you for reading our work and supporting our message🗡️


Great breakdown lads
Why only trade crypto? Small cap stocks can trade like altcoins while often being more liquid and having more available information.